Proximity Networks - Ideal for Cellular Data
Generating a Network Based on Proximity
We will go over another simple example of creating networks. This one is even easier, as it only requires nodes to function, and simply groups nodes as connected pairs based on their distance to each other. Open a new instance of NetTracer3D and once more load in the binary segmentation of the nodes that was created above. First, use ‘Process -> Image -> Label Objects’ to assign each binary object a unique label. Next, select ‘Process -> Calculate -> Calculate Proximity Network’.
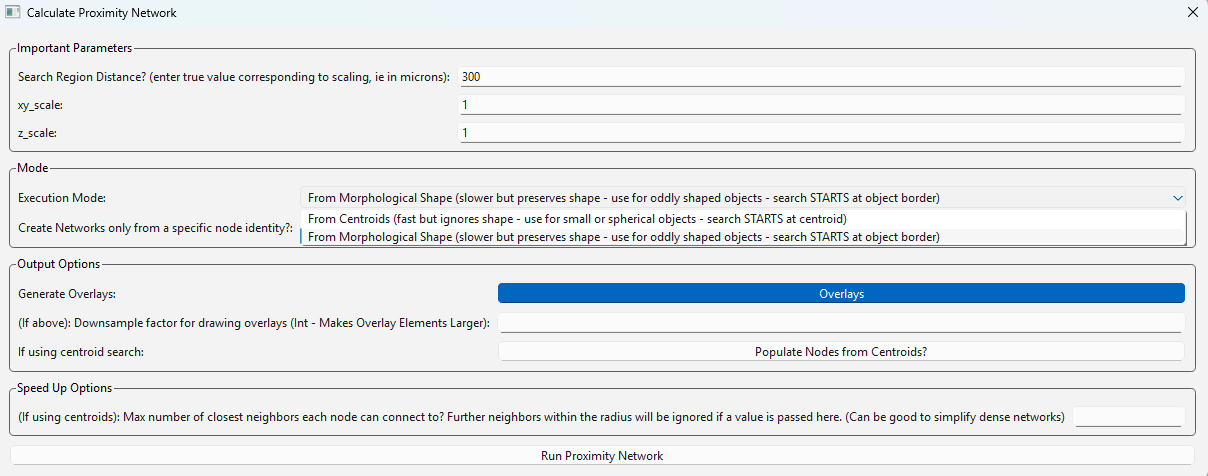
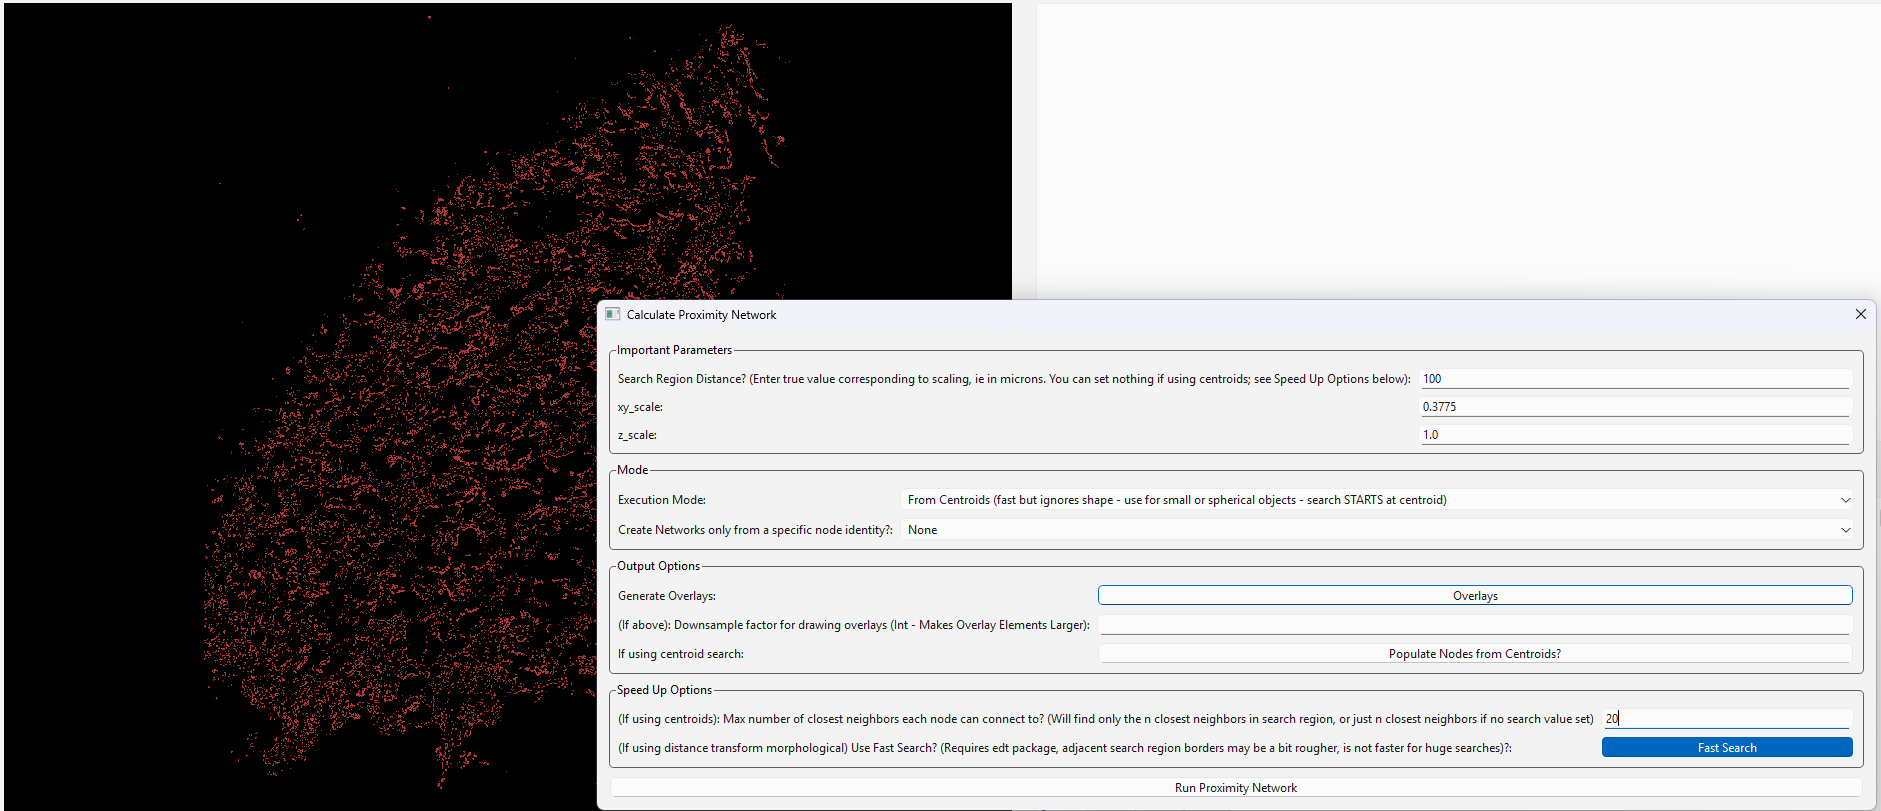
Here we can see the menu to generate proximity networks. The search distance here is set to 300, which means nodes will look 300 pixels out for connections (although this will correspond to your scalings). Note there are two options available for searching, shown in the carrot dropdown next to ‘Execution Mode’. The first option searches from centroids and works quite well with big data as the data structure is far simpler. The second option searches from object borders and may be slower on large images by comparison. In this case, I use the second option since these objects are heterogenously sized. You can optionally enter a number of nearest neighbors at the bottom instead of a search distance, or just combine these parameters to find a set number of neighbors within a specified distance. For more information on using this algorithm, see ‘Process -> Calculate Network -> Calculate Proximity Network…’
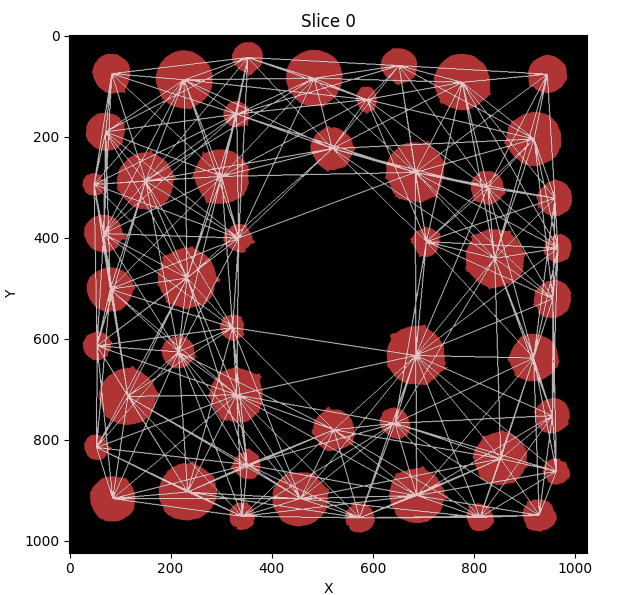
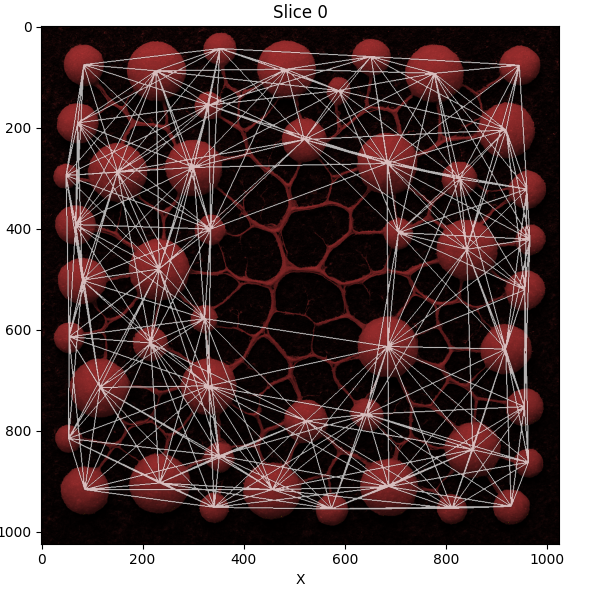
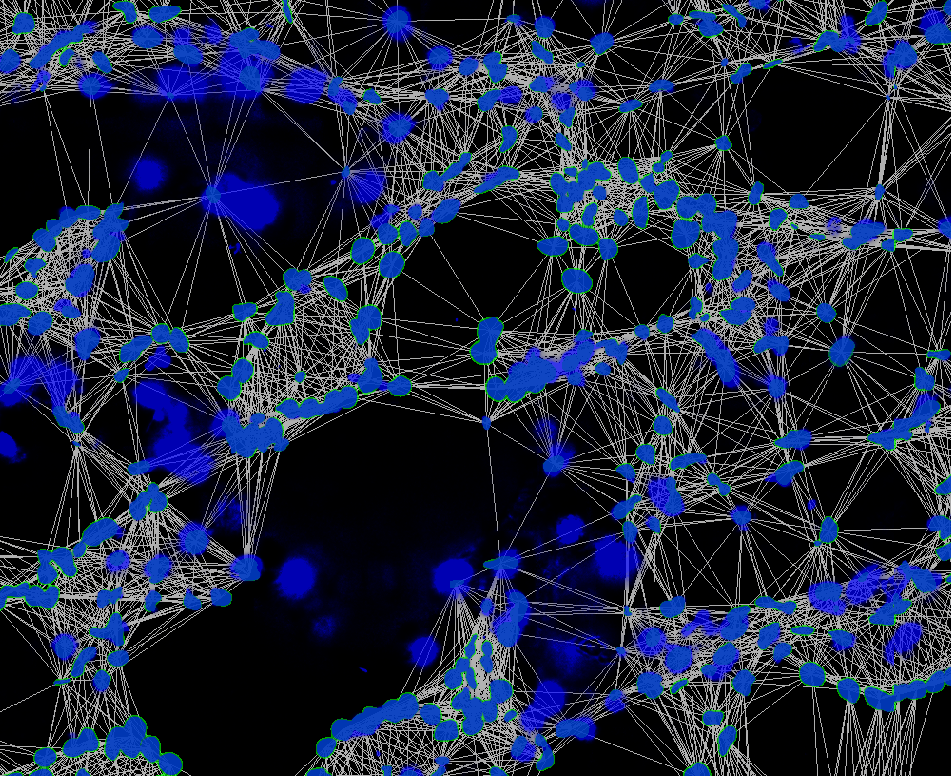
And after algorithm execution:
Proximity networks are a generic way to group together objects in 3D space and are ideal, for example, for grouping together cellular neighborhoods. One use for such cellular neighborhoods is grouping them into communities and analyzing their composition!
Cellular Data - Modality of Analysis
Generally speaking, there are two primary ways to analyze your cellular data in NetTracer3D.
- Both of these modalities will start with these steps
Segment your cells beforehand (ie in Cellpose) from a DAPI and/or membrane channel, or generate hexagonal nodes from the Generate menu.
Load the segmented cells into the nodes channel. Assemble the channels of interest from your image into a folder and then use ‘File -> Images -> Node Identities -> Assign Node Identities from Overlap with Other Images’. This will calculate the average expression of each node across your channels - save this spreadsheet. You will also use thresholding to assign your nodes each channel identity.
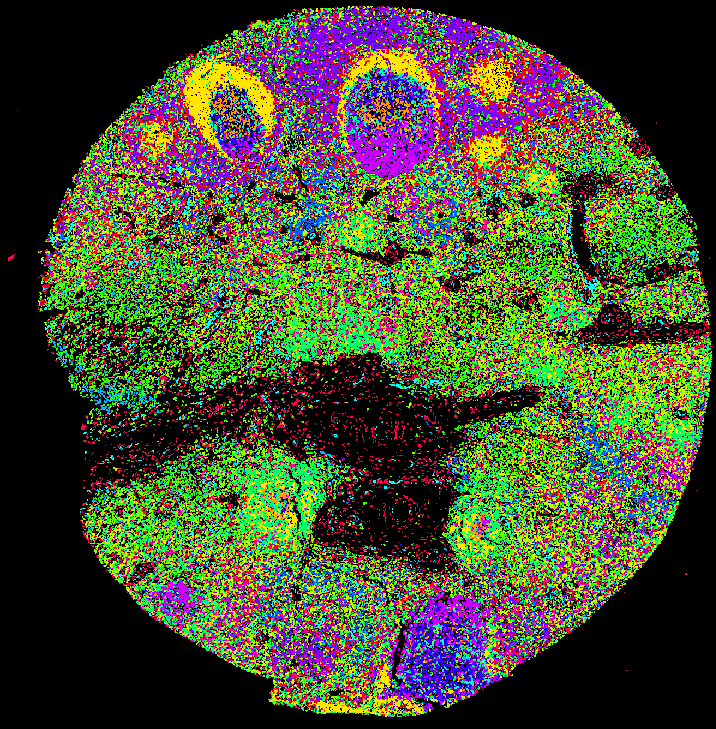
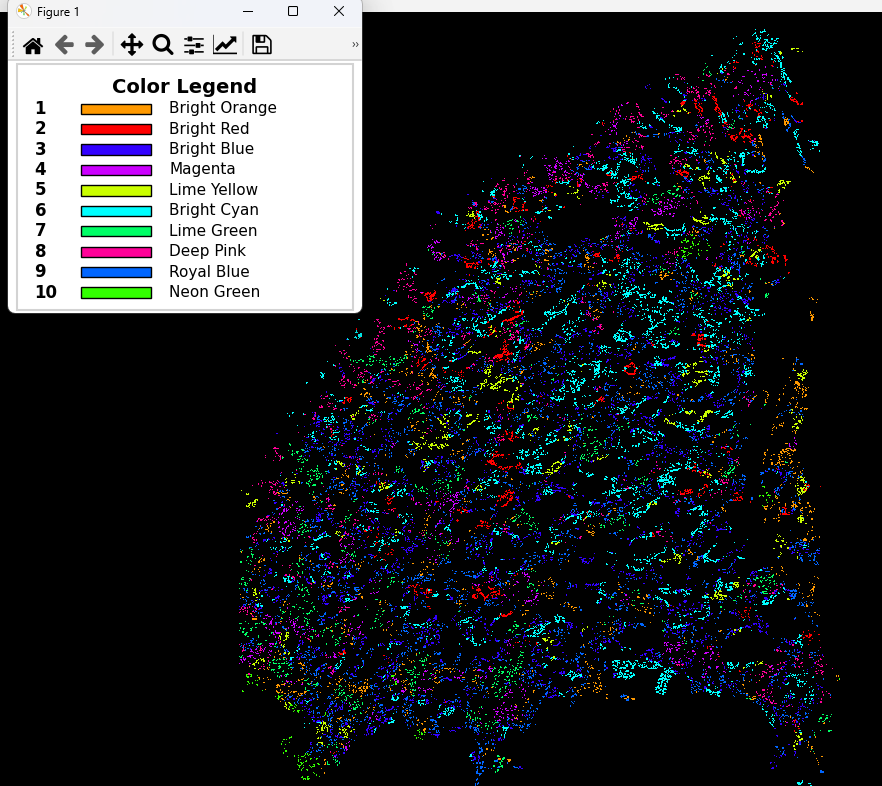
1. The first analysis option is to 1. Create a proximity network from your cells bearing node identities. I recommend using some number (ie 20) of nearest neighbors within a reasonable distance. Then use ‘Analyze -> Network -> Create communities based on Node’s Immediate neighbors’ to group your cells into communities based on the recurrant neighbor patterns. Note this is different than the default community clustering from the network. The network clustering will more reveal spatial aggregates of cells based on their literally clumpiness in the tissue, which may be inappropraite for dense cellular arrangements. * Then, ‘Analyze -> Network -> Calculate Community Composition…’ will show you what your communities are comprised of. * You want many channels for this to work well. The more channels, the more distinct regions of your tissue will appear. * Here is the result of this community detection applied on a lymph node using NetTracer3D:
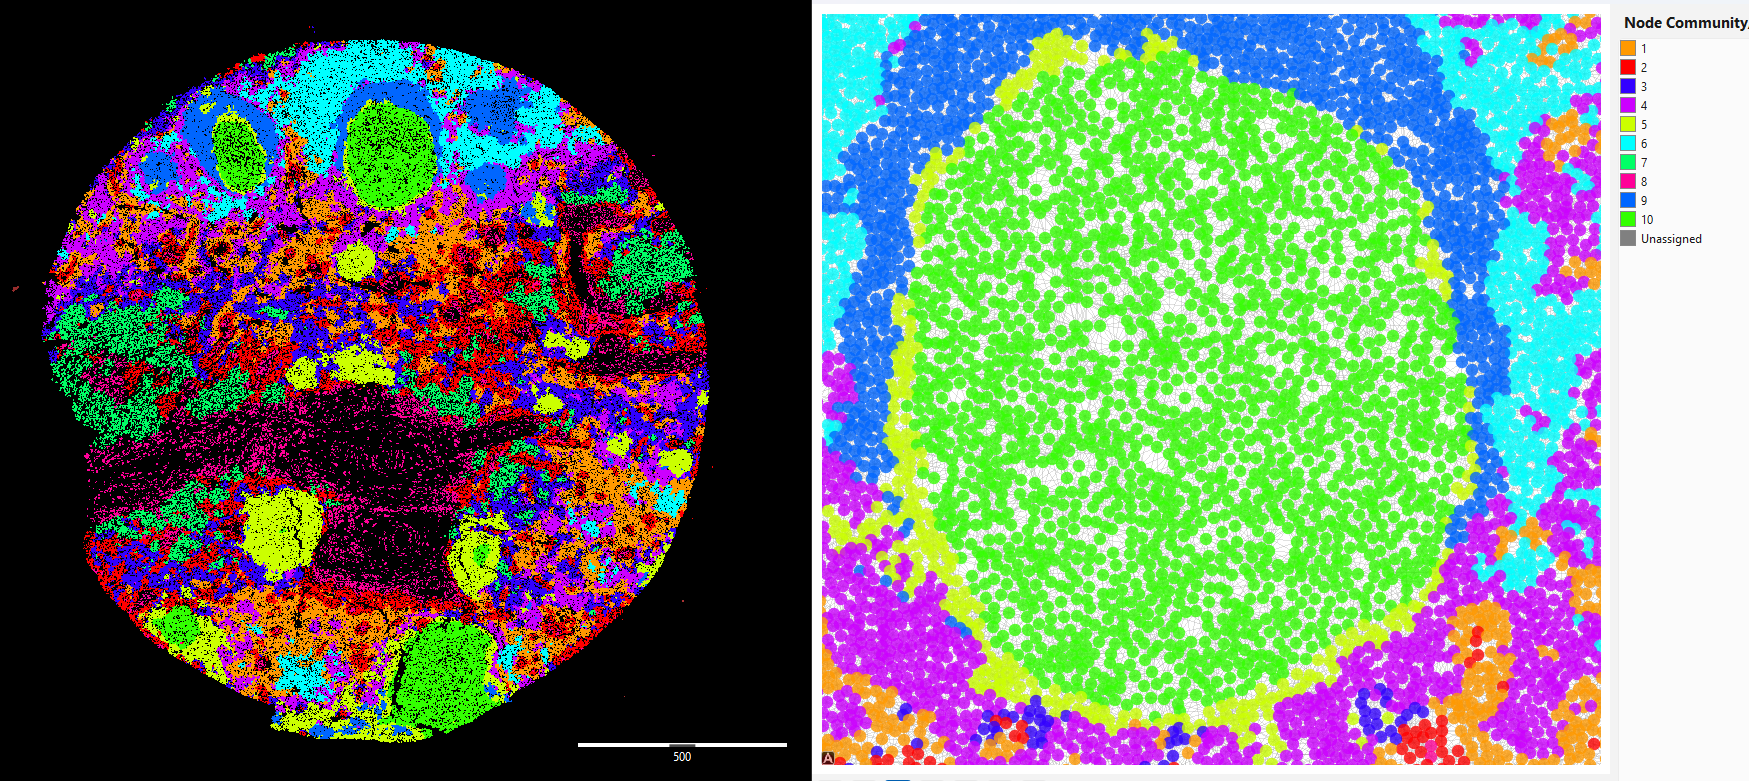
*This approach is good for classifying your tissue
2. The second analysis option requires using the intensities spreadsheet you created earlier. Use ‘Analyze -> Stats -> Show Identity Violins…’ and find the spreadsheet you created. * From the menu that appears, find clustering option and enter a number of communities to create based on the fluorescent expression profile for each cell. I recommend keeping the intensity heatmap checked, as it will inform you what the resultant communities are composed of.
*This approach is good for finding types of cells
Using Proximity Networks for Advanced Cellular Neighborhood Analysis - Walthrough Analysis of CODEX sample
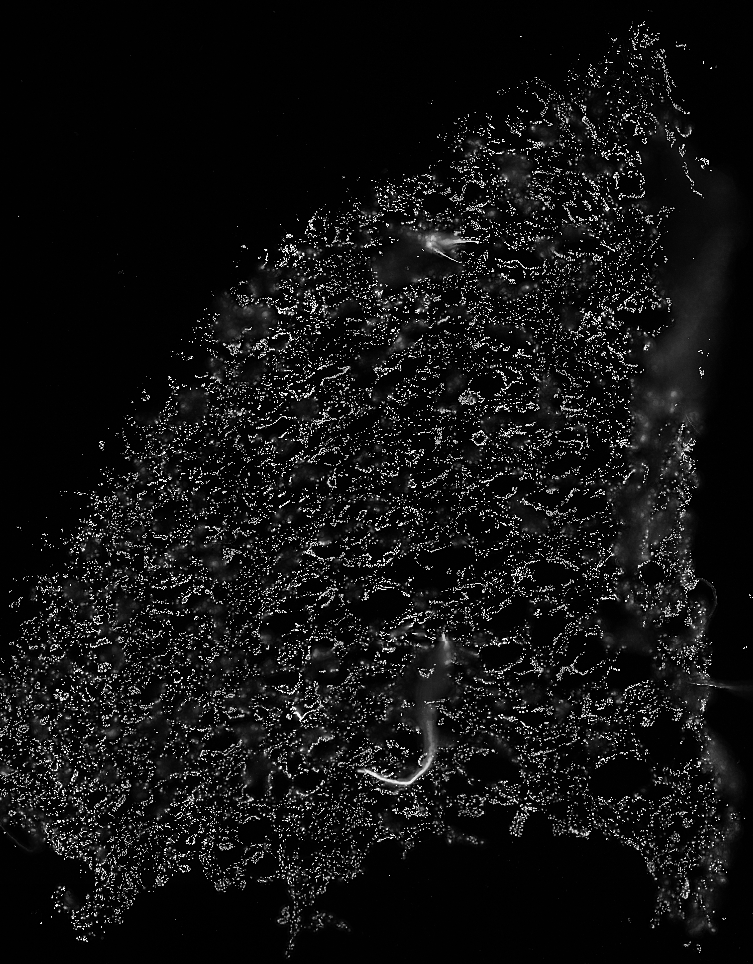
Proximity networks generally make the best use of the ‘node identities’ property, which lets us eventually lasso together groups of nodes into neighborhoods that share local expression of similar cell types. Node identities can represent anything about your node (ie what it is, its qualities, etc). They can be assigned by loading the node identities directly from a spreadsheet (see Using the Spreadsheet Loader), however we can also pull them directly from images. One useful setting for this is multiplexing (where a tissue is imaged over and over across a plethora of markers). I will use the following CODEX dataset as an example, obtained from this publication: Canela, V.H., Bowen, W.S., Ferreira, R.M. et al. A spatially anchored transcriptomic atlas of the human kidney papilla identifies significant immune injury in patients with stone disease. Nat Commun 14, 4140 (2023). https://doi.org/10.1038/s41467-023-38975-8 This is an image of a renal papilla. Here it is stained with DAPI (Nuclei).
There are a few options for getting multiple channels into the same set of nodes. The first is to merge the nodes directly with ‘File -> Images -> Node Identities -> Merge Labeled Images into Nodes’. If you have segmentations of seperate objects already (ie different cells or different FTUs), this option can be used to pull them into NetTracer3D as different identities. However, this doesn’t work when the nodes in each channel are on top of each other (ie the same cell with a different marker), or if the task of segmenting each is too burdensome.
Because of this, we will use the second option (outside importing the nodes with identities from a spreadsheet), which ‘File -> Images -> Node Identities -> Assign Node Identities From Overlap With Other Images’, which is designed for CODEX-type images specifically.
This option uses a primary segmentation of all nodes (for example, from a DAPI stain), and assigns each node an identity based on what labeled markers from the other channels that the node overlaps with.
To make use of this, we first need to obtain an initial set of segmented nodes to use as ‘anchors’. This will typically be done by segmenting DAPI channels.
NetTracer3D offers a binary ML-segmenter. If we used it to segment our cells (like we did in the previous example), we could label them afterwards with direct labeling if they don’t overlap. Should they overlap, we can use binary watershedding. A third option is to just segment out the background of the image with the intensity thresholder and then use gray-watershedding to split the foreground into labeled nodes. (See All Process Menu Options for explanations on each of these if interested).
While those options are good for certain types of data, or for quick results, there are already great tools for segmenting cells with high specificity. One option is Cellpose3: Stringer, C., Pachitariu, M. Cellpose3: one-click image restoration for improved cellular segmentation. Nat Methods 22, 592–599 (2025). https://doi.org/10.1038/s41592-025-02595-5
Cellpose3 can be bundled in the NetTracer3D package if the user wants, although it is somewhat mandatory to use a GPU with. For the most accurate results though, I recommend segmenting clustered nuclei with a user-trained model in Cellpose3, like shown here:
Please see https://cellpose.readthedocs.io/en/latest/ for specific instructions on how to install/use cellpose
If you can’t segment cells or just don’t want to, you can generate artificial hexagonal nodes from the Generate menu that similarly can partition your tissue.
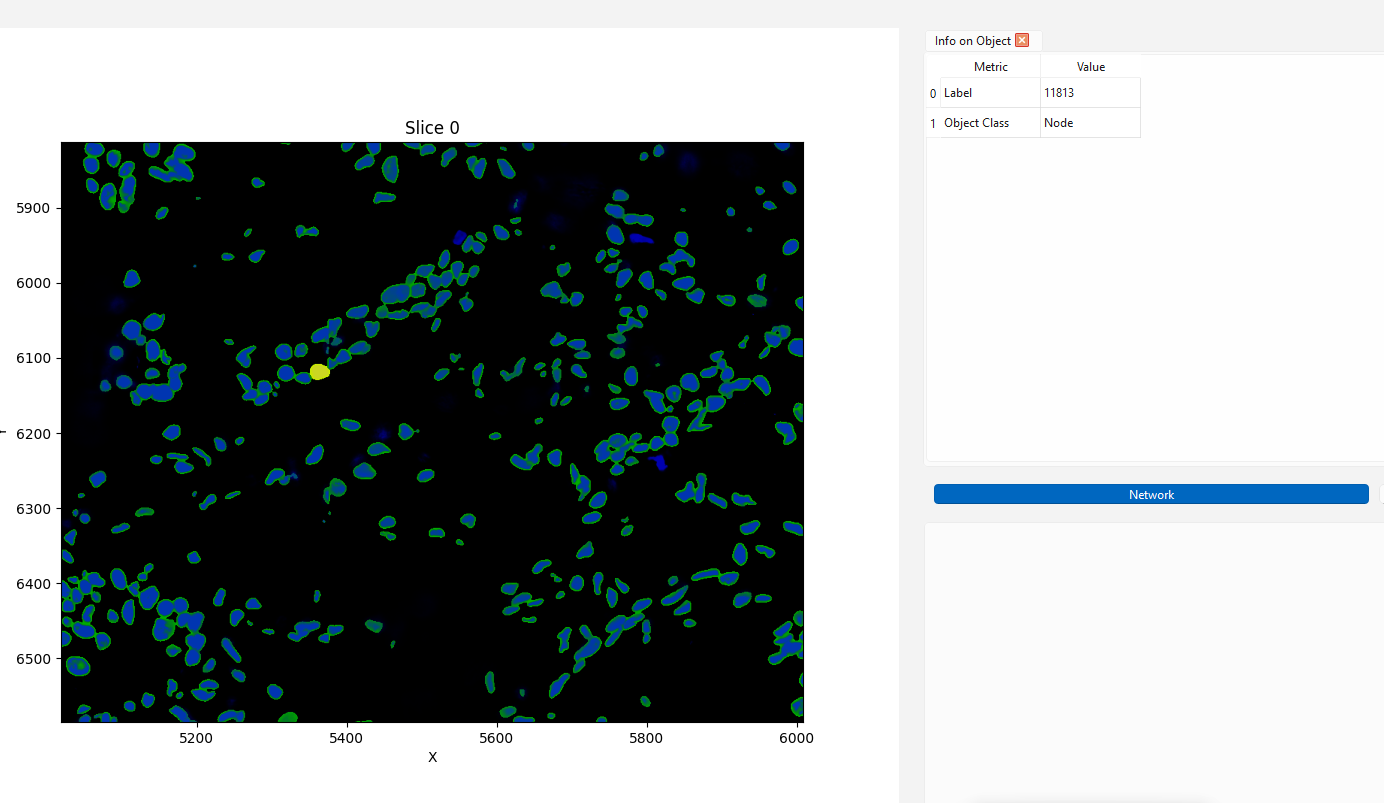
Here are the DAPI segmented nuclei (green borders) overtop the original DAPI channel in NetTracer3D. I am selecting one in yellow
Regardless of how we do it, once we obtain our segmented DAPI nuclei we want to load them into the nodes channel.
Here, we have a few options on how to get the rest of the desired channels into the node identities.
One option that’s both fast and robust to error is ‘File -> Images -> Node Identities -> Assign Node Identities From Overlap With Other Images’, then selecting ‘Manual’ for the binarization strategy.
To use this, you will first need to place all the channels of interest into a folder, arranged as separate .tif/.tiff images (ImageJ can be used to easily split up your channels if they are saved in a stack). For this mode, the channels should be raw instead of segmented.
Next, use the following options and select your folder like so:
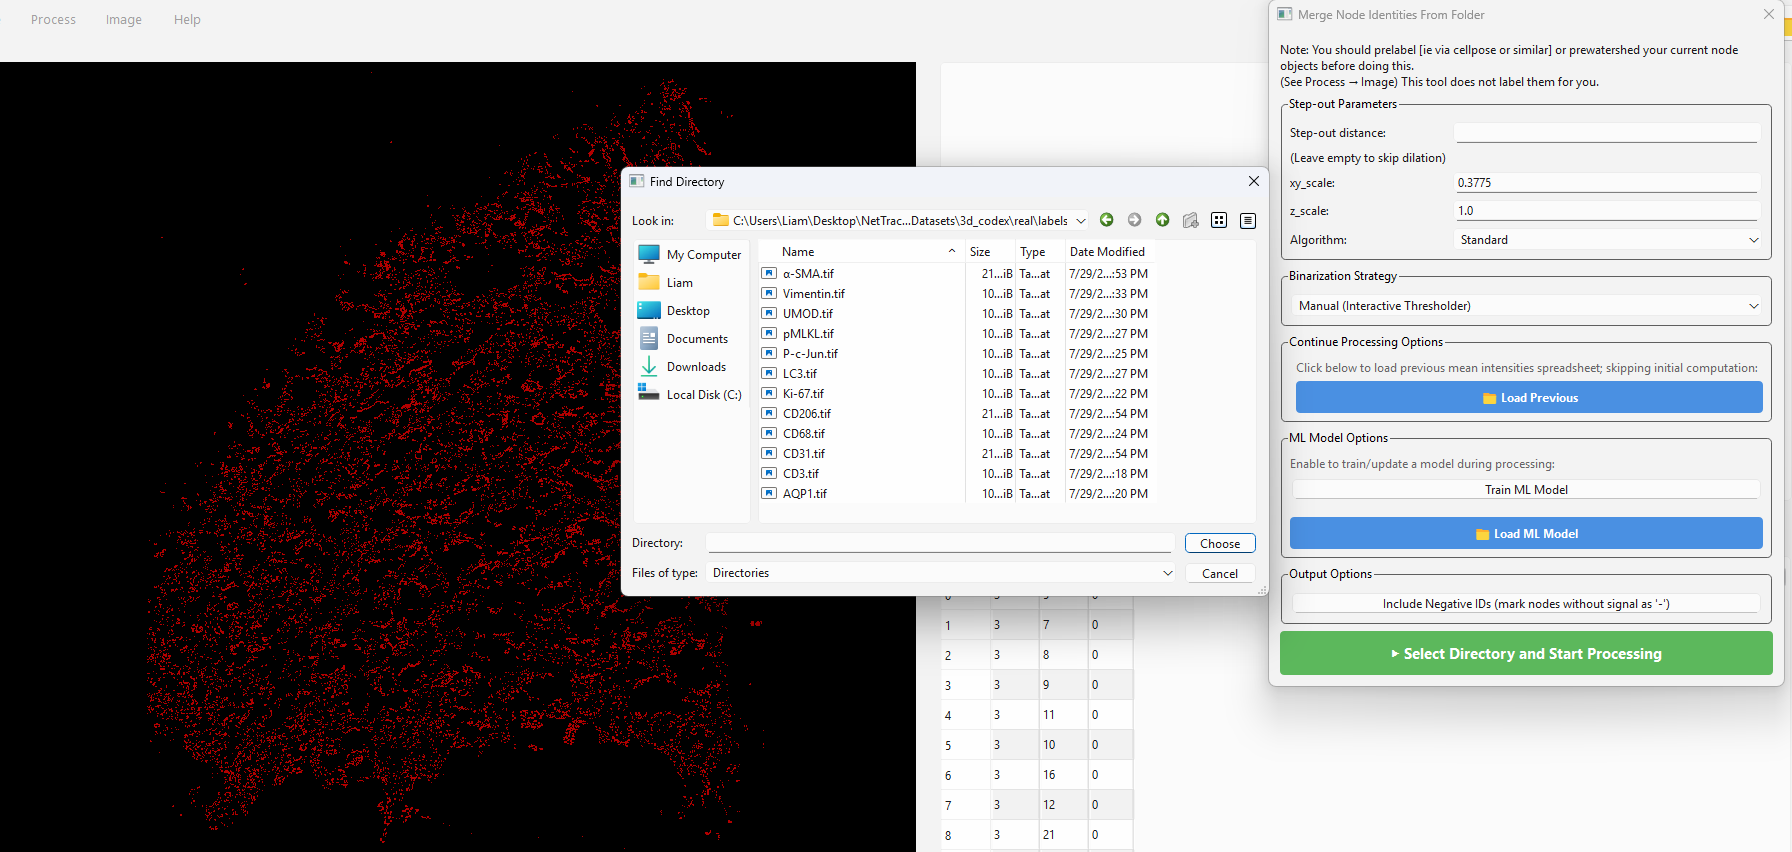
The step-out distance parameter can be used to optionally make each cell consider a wider area, such as to account for staining beyond the nuclei. If you segmented membranes or just don’t want this you can skip it.
NetTracer3D will then do some calculation - it will evaluate each cell for the average intensity it expresses in each channel.
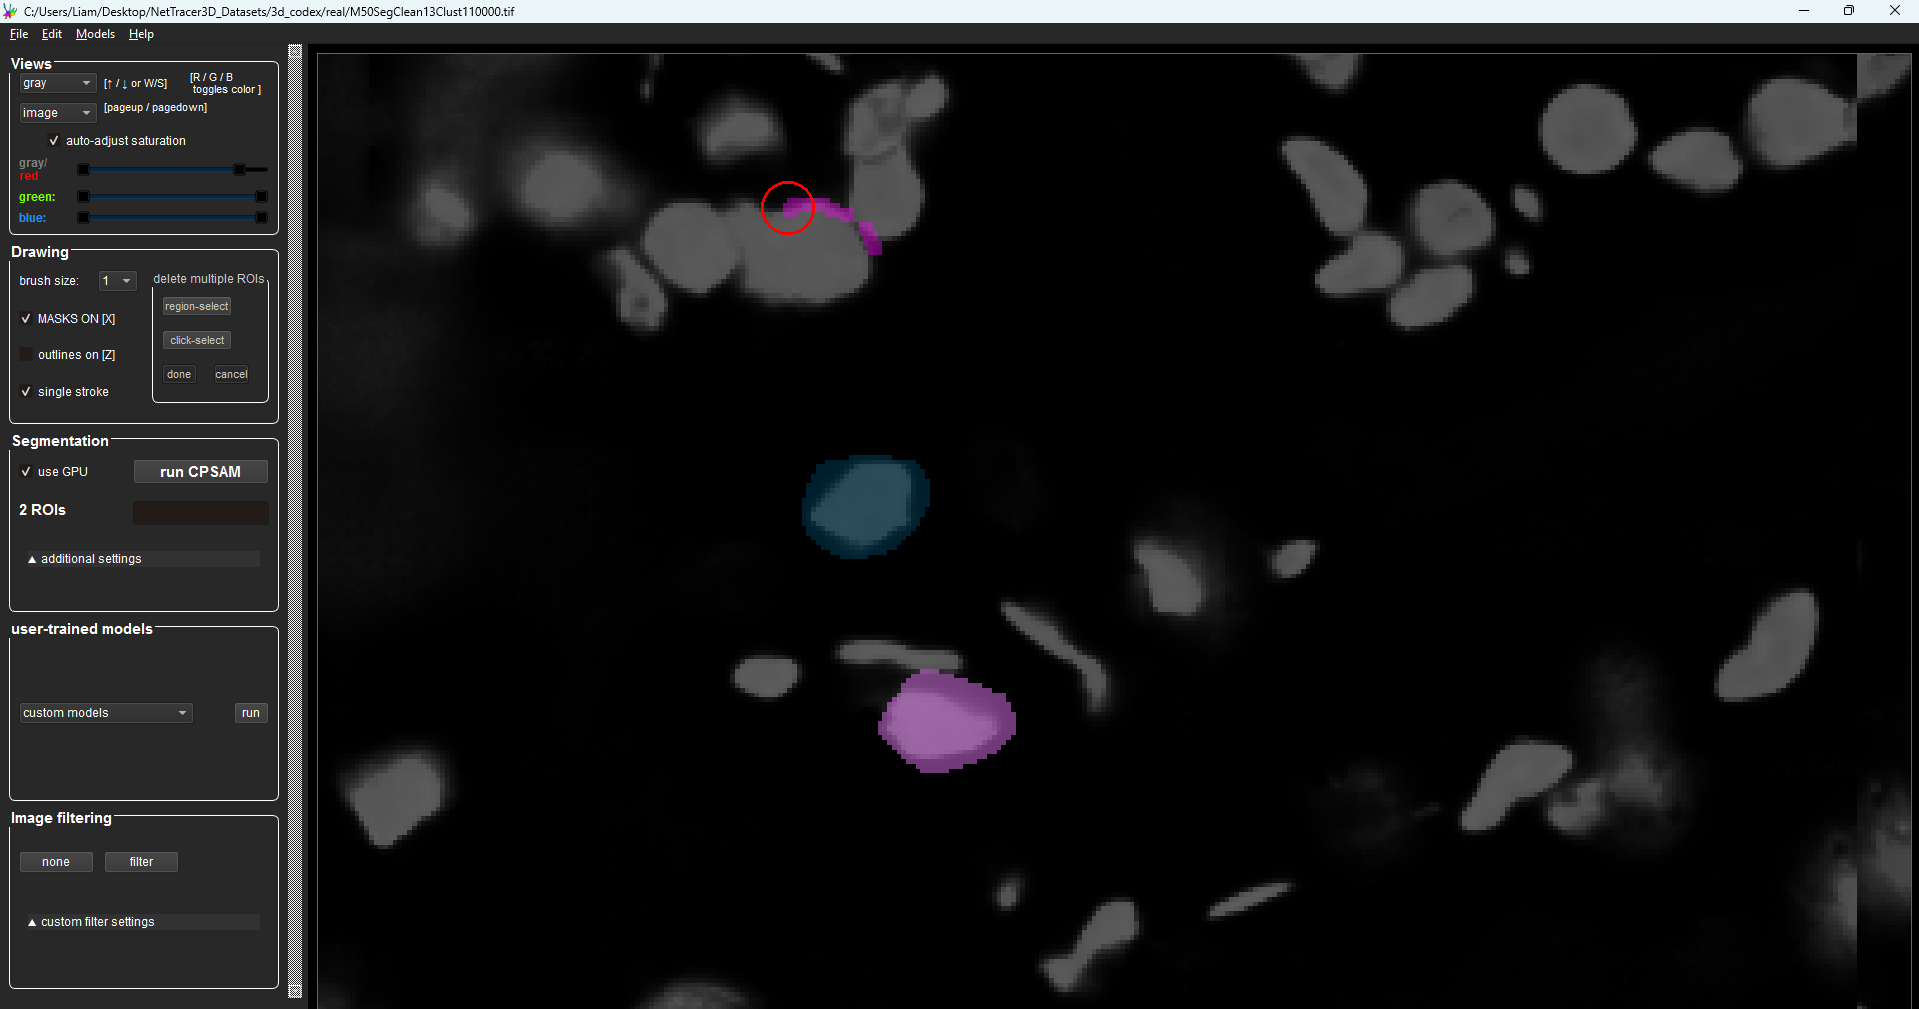
Once its done, you will get prompted to do manual thresholding on each image, telling NetTracer3D which subset of cells you would like to assign that identity based on their relative intensities in that channel. For example, here I am doing CD68 (stains macrophages):
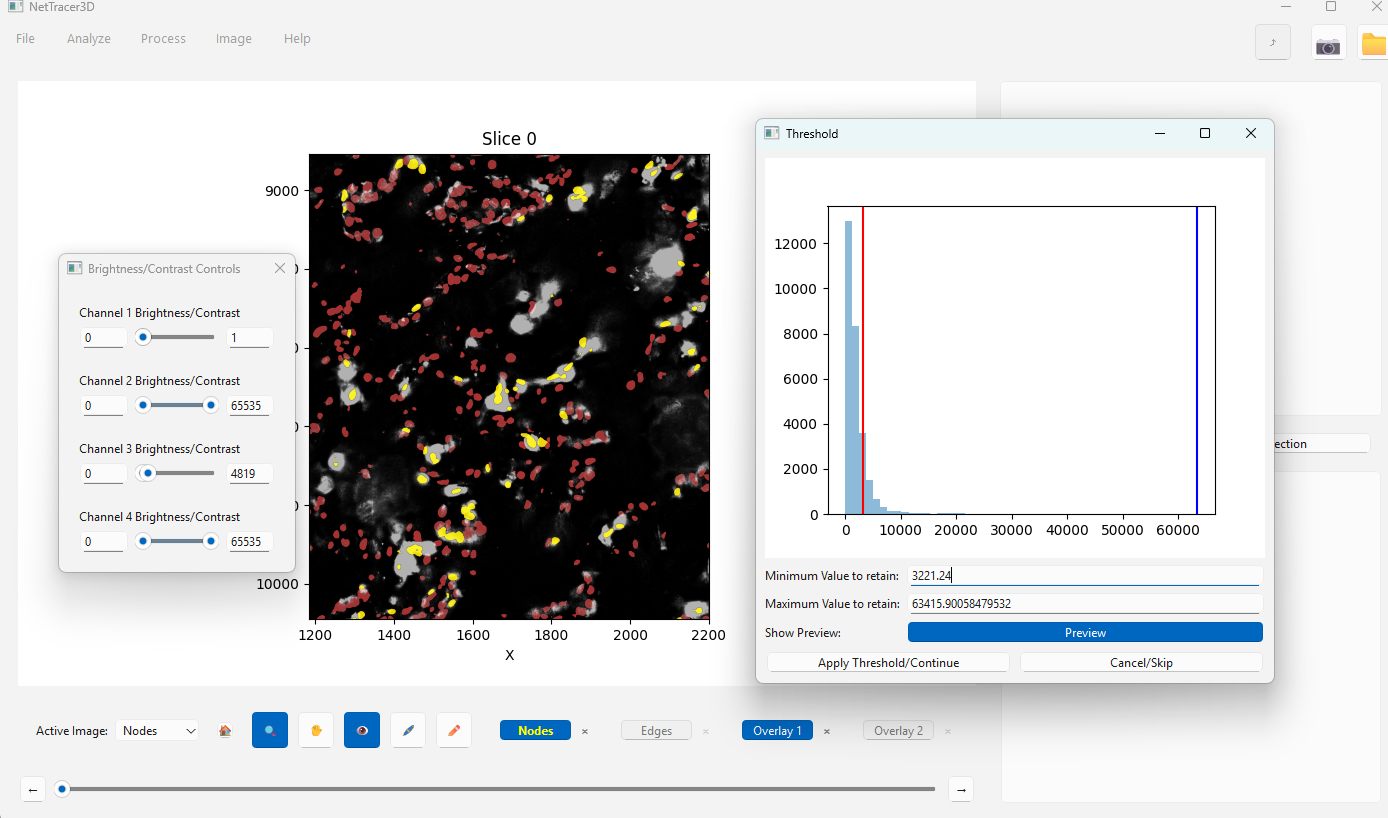
During the thresholding steps, I am able to interact with NetTracer3D’s image canvas. My nodes/cells remain in the Nodes channel. Each channel being thresholded will be temporarily rendered in the ‘Overlay1’ channel. I use the brightness/contrast controls to make them more visible, then zoom up close. I use the thresholder on the right to select the cell nuclei that seem like they truly overlap with the channel data, highlighted in yellow. This repeats for all channels in the folder.
After all channels have been thresholded, the nodes will be assigned identities, as shown in the upper right table. If this manual assignment was used, if the option to generate the UMAP was selected at the start, I will also get this UMAP comparing the Z-score for each marker of the cells I pulled out to assign identities.
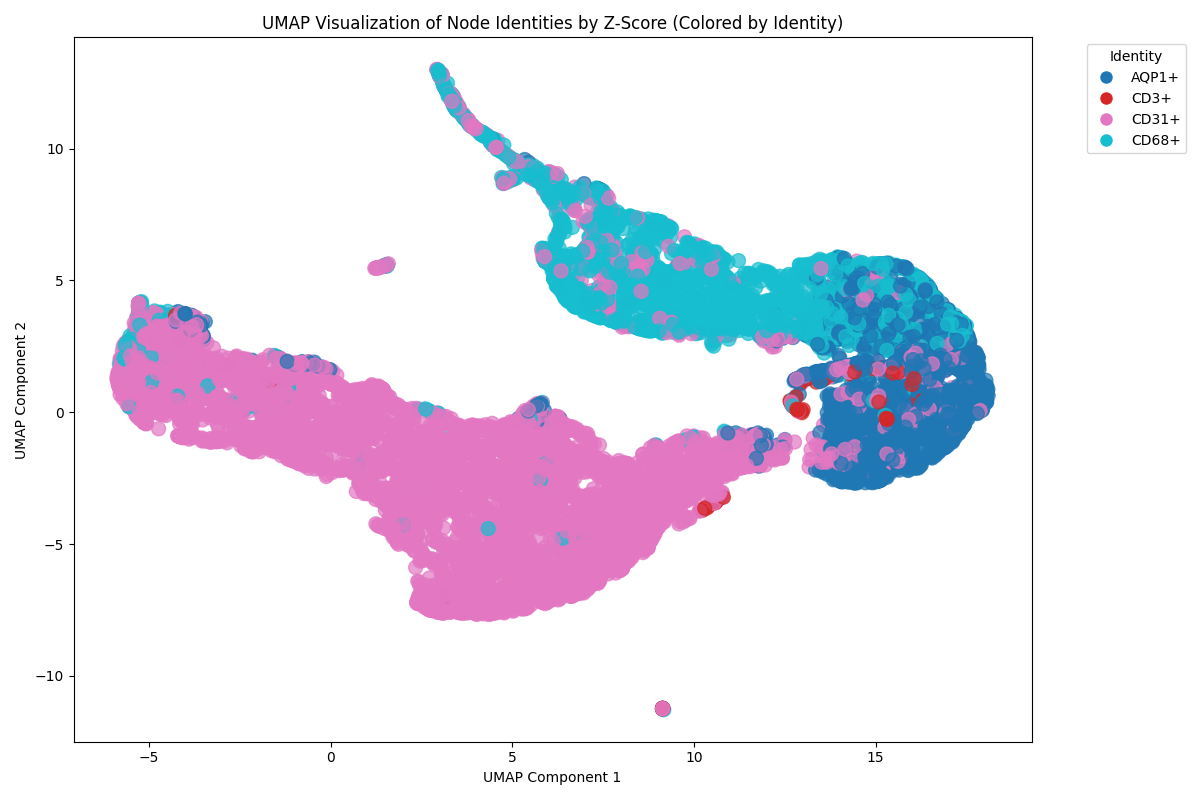
Note that the UMAP adds an extra processing step but it can be a decent option for validation. If your cells are overlapping where they shouldn’t, either the thresholding step or the image itself was poor.
This method of identity assignment can be quite useful to shield against phenotyping errors, since the mean intensity of each node is considered when assigning cells, with the user-in-the-loop, rather than just auto-assigning them based on overlap with the channel’s segmented foreground.
Grouping Cells By Shared Expression Profile
When we finish running the above steps, we will be prompted to save a spreadsheet containing the average intensity of each channel for each cell. We will want to save that, as well as our progress so far, as we especially do not want to lose our assigned node identities. Utilize ‘File -> Save As -> Save Network3D Object As’ to save the current session.
Next, from the menu bar, select ‘Analyze -> Stats -> Cellular-Esque Analysis’. We are prompted to find the intensities spreadsheet we just saved. After finding it, we open this menu:
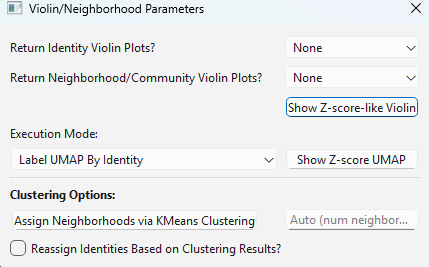
From this menu, we can generate violin plots for each marker. The markers are normalized based on what we called the lower-end threshold for what is valid as that identity.
As an example, we can generate this violin plot containing all our cells we called ‘CD68’:
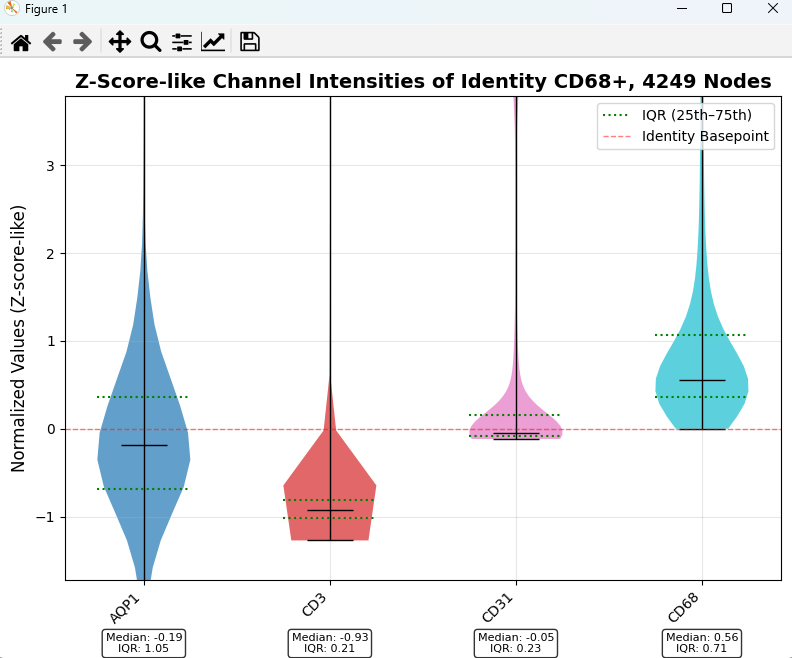
This plot is quite easy to interpret. Any value above 0 represents what we called a ‘valid’ representation of that identity during our assignment phase. We can see that our CD68 violin is completely above 0, as we are only looking at cells we assigned CD68 anyway.
Therefore, any portion of the other plots above 0 means that our CD68 cells are also showing valid expression of that marker. Here, we see the most overlap with ‘CD31’.
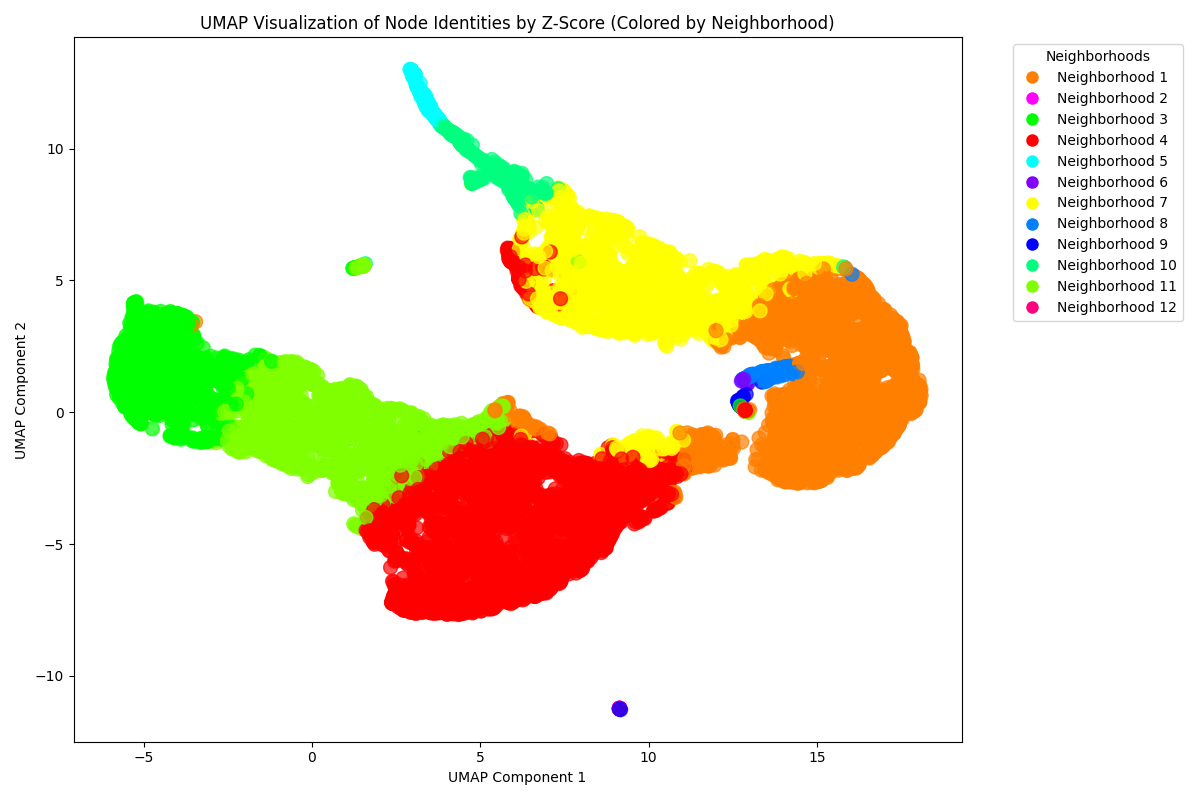
From the previous menu, we can group all our cells into neighborhoods based on the overlap of their channel markers. These neighborhoods can be used to re-label our UMAP from before:
We can also create violin plots akin to those shown previously, but for our communities or neighborhoods:
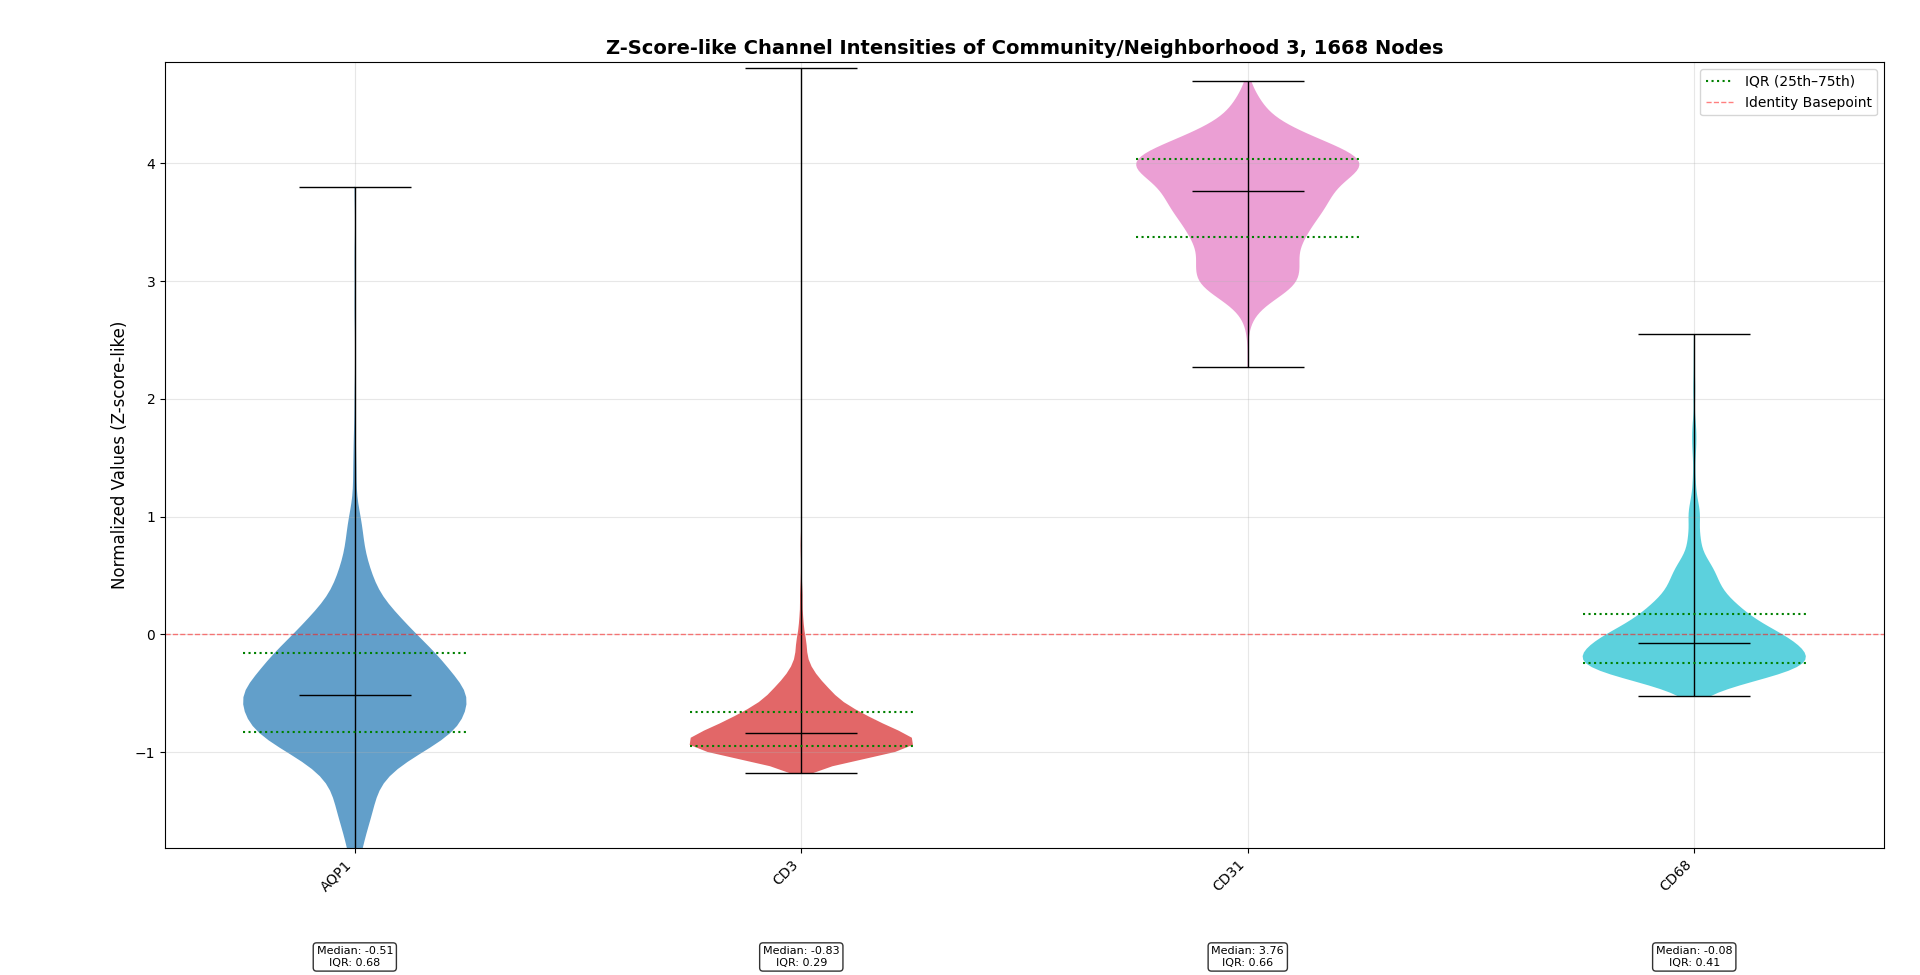
This neighborhood shows strong expression of CD31 but weaker expression of the other markers. It likely just represents blood vessels. This can be an effective way to query different unique cell phenotypes in our image.
Grouping Cells By Neighborhood
Moving on from marker-based analysis, we may be interested in NetTracer3D’s spatial capabilities. We will evaluate this over a broader set of markers. While this system is primarily designed to start with our user-in-the-loop per-channel thresholder, more nuanced segmentations can be created and also brought in via auto-assignment capabilities. This includes use of pre-binarized channels (ie you already segmented out the foreground), use of a neural network (which you can train while doing the manual thresholding and reuse) or just reapplication of previous threshold settings.
Now once more, we calculate a proximity network. I assign a search region limit of 100 microns and opt to have it find it’s nearest 20 neighbors in that area. I don’t use this here, but a cool feature to note is “Create Networks only from a specific node identity” can be used to make connections only start from a certain identity, for highly specified analysis.
I am going to use centroids to make this proximity network, which is acceptable when my objects are circuloid/cuboid. Centroids can be obtained with ‘Process -> Calculate Network -> Calculate Centroids’, although if they don’t exist and you run this, NetTracer3D will prompt you to calculate them. In this instance, I tell the Calculate Centroids Window to ‘Skip ID-less centroids’, which is a parameter that makes it exclude any centroids for Nodes that were not assigned an identity, and likewise those nodes will be excluded from the network. If I am interested, though, in having these ID-less nodes in the network, ie to represent the tissue architecture, this option does not need to be used. Finally, ‘Process -> Modify Network/Properties’ can be used to kick out centroids that don’t have identities if I change my mind.
Here is an example of what the network itself looks like.
To cluster the nodes based on their network participation, I use ‘Analyze -> Network -> Create Communities Based on Node’s Immediate Neighbors…’ to place the nodes into communities.
*My nodes, having been assigned a community position, based on their network involvement, via the ‘Louvain algorithm’. For the proximity network, this offers a way to group nodes based on their spatial relationship. This colored overlay can then be obtained with ‘Analyze -> Data/Overlays -> Code Communities’.
Next I can use ‘Analyze -> Network -> Calculate Community Composition’ to see the relative compositions of each community and/or neighborhood. There are a few informative graphs I can generate, such as the below heatmap:
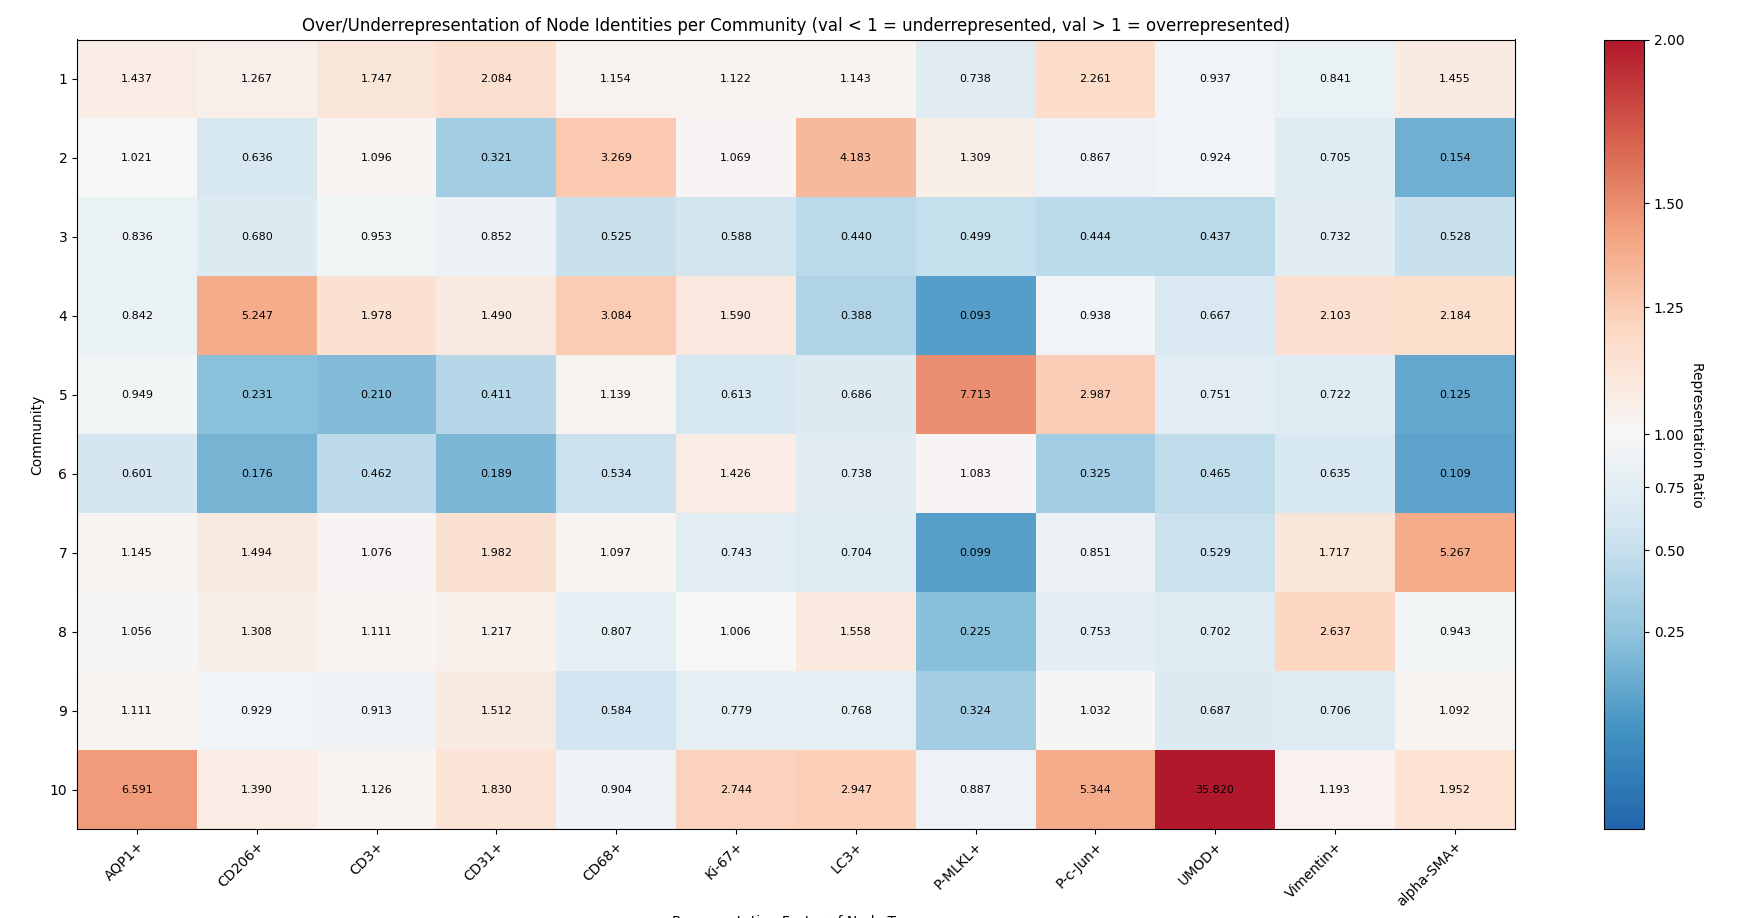
This graph tells us the log-normalized overexpression/underexpression of each label in a community. In short, any value greater than one (red) is over-represented in that community, while any value elss than one (blue) is under-represented in that community.
You can also assign communities based on your network although it’s less specific in cellular datasets, better for finding spatial aggregates of objects for proximity networks. Although one option if you do opt for network communities and want similarity clustering is to convert the network communities into Supercommunities via ‘Analyze -> Network -> Convert Network into Supercommunities’. Just be aware that this is telling you something totally different than my recommended cellular analysis pipeline.
Optional - Reassigning Node Identities for Tailored Analysis
After assigning identities, we may be interested in reassigning nodes with multiple identities to their own class. For example, perhaps a group of markers represents a distinct cell type. Since its common for some cell types to co-express markers, it can be a good way to group them into more specific categories (ie T-cell, instead of lymphocyte).
This can be used to do more specific downstream analysis on one cell class, such as making proximity networks just from that cell class and evaluating what tends to appear around that sort of cell.
This is most easily done in NetTracer3D by using ‘Process -> Modify Network/Properties’, then choosing ‘Change/Remove Identities’.
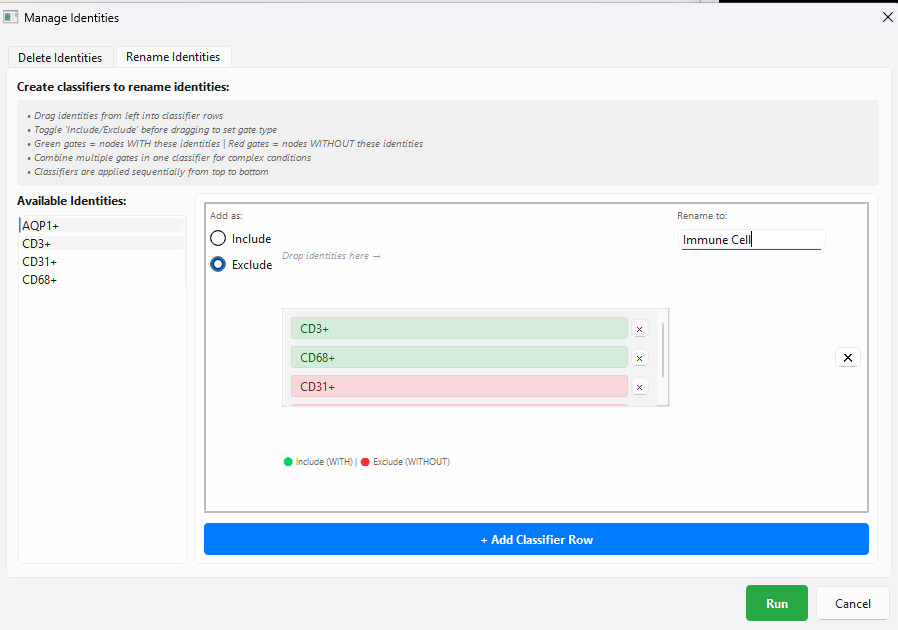
*In this menu, just drag identities you want your renamed nodes to have to the middle from the left while ‘Include’ is enabled. You can also enable ‘Exclude’ to find only nodes lacking that identity. Assign a new name on the right and choose ‘Run’.
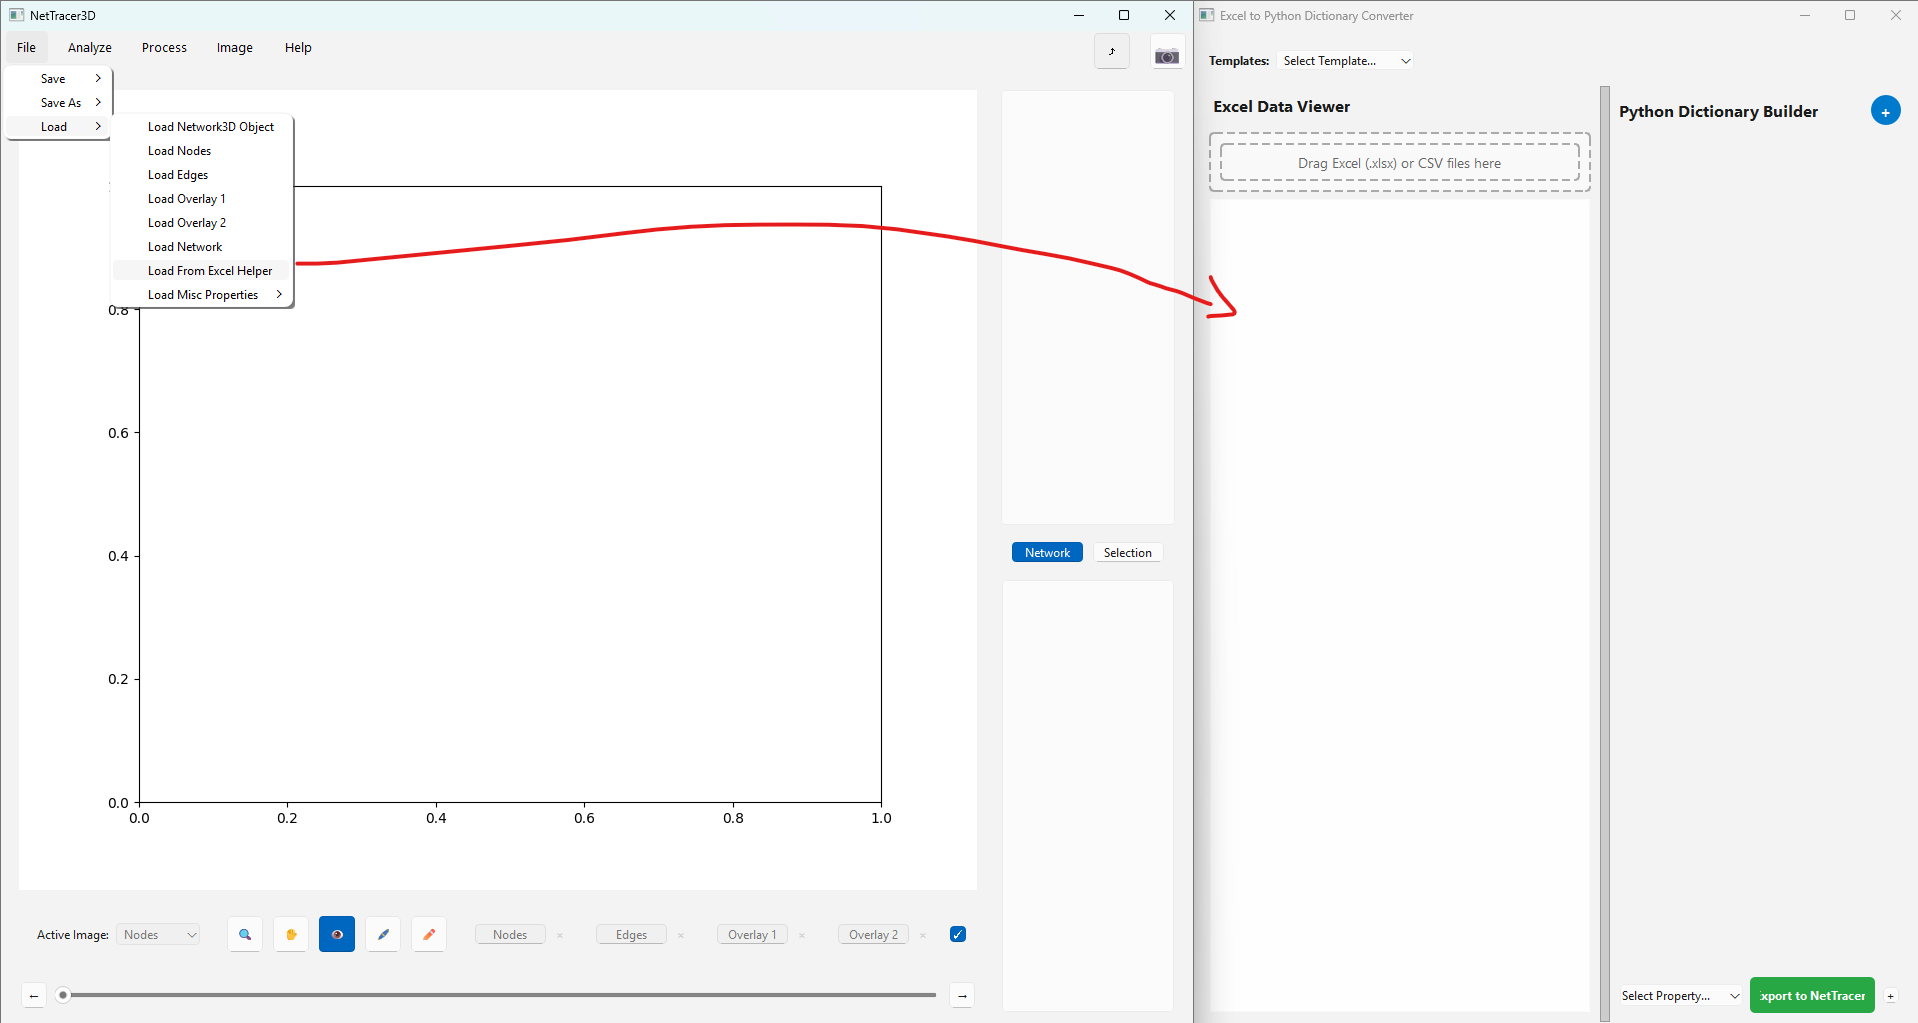
Or, we might also have already assigned nodes some group of identities in a program like QuPath. Whatever the case, we will want to get the information with the node identities in a spreadsheet (ie save the node identities spreadsheet we just got by right clicking the upper right table). We can then use ‘File -> Load -> Load From Excel Helper’ to reassign the identities and pull them back into NetTracer3D:
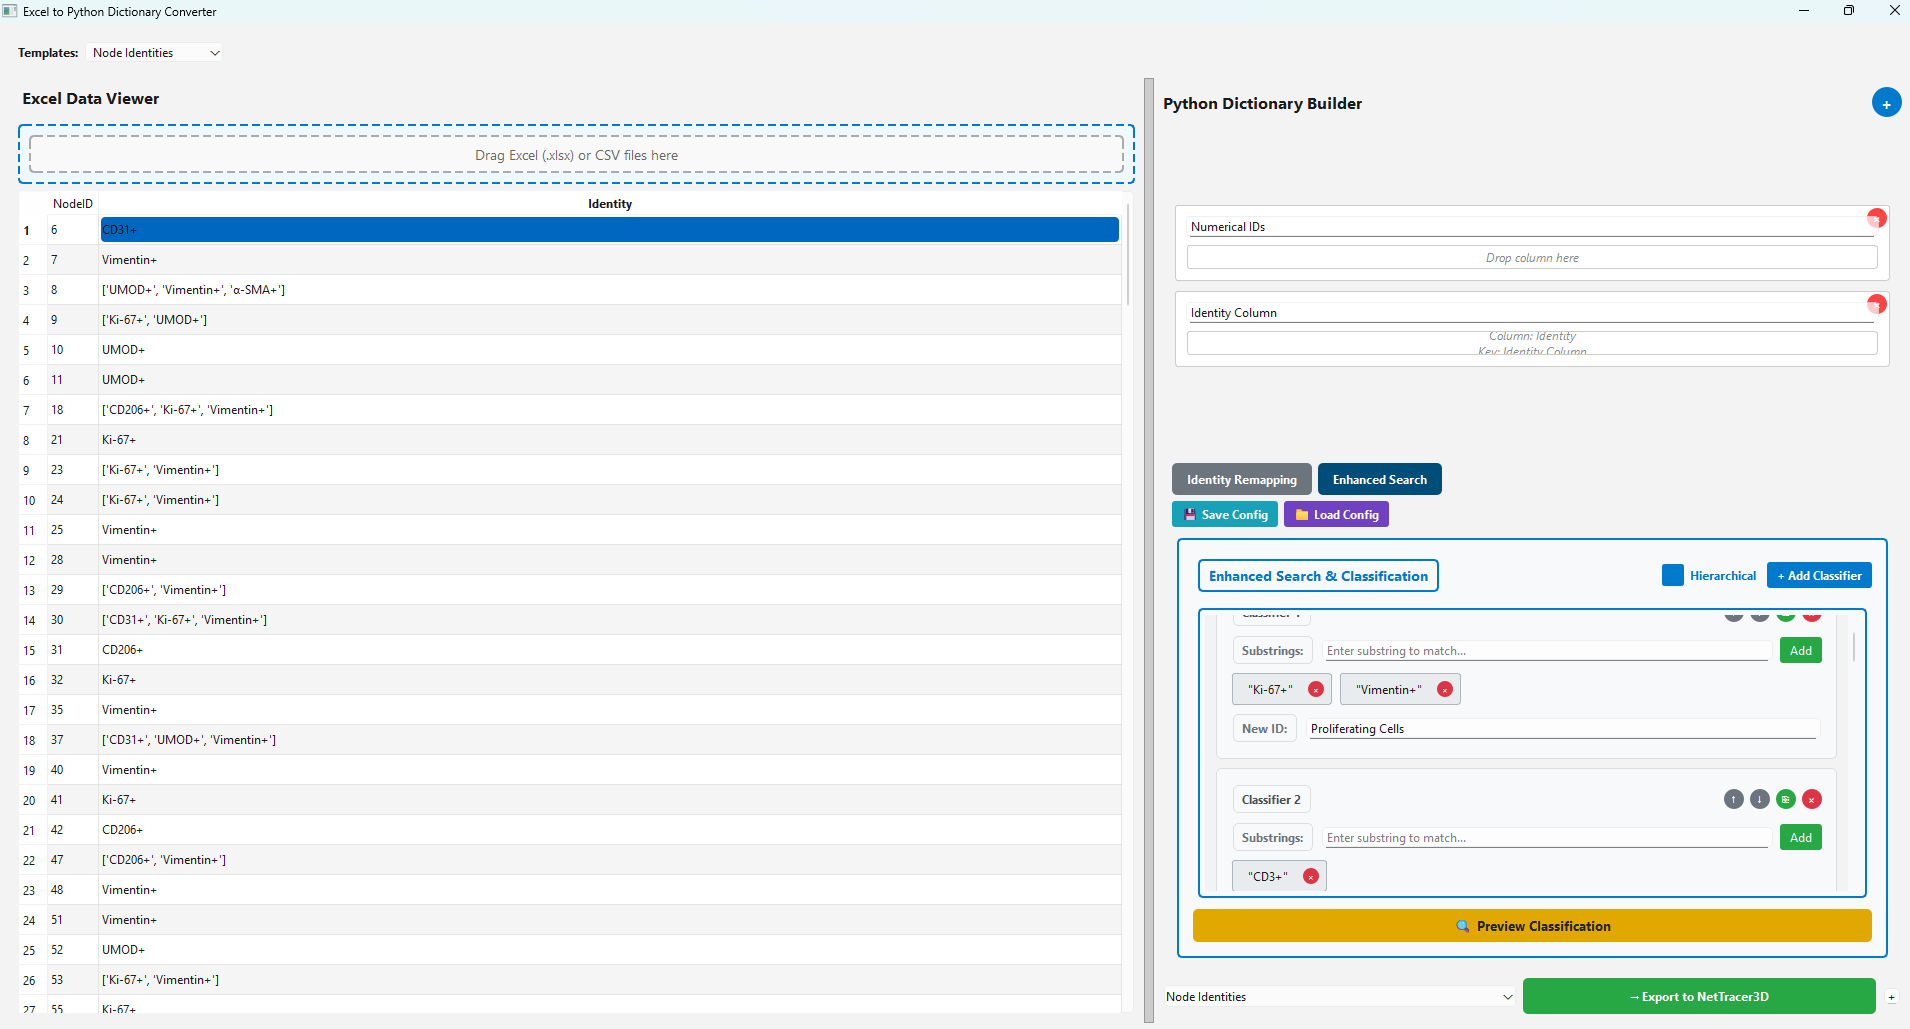
Here we are telling NetTracer3D to reassign anything containing the terms ‘Ki-67+’ and ‘Vimentin+’ to the identity ‘Proliferating Cells’, just as an example.
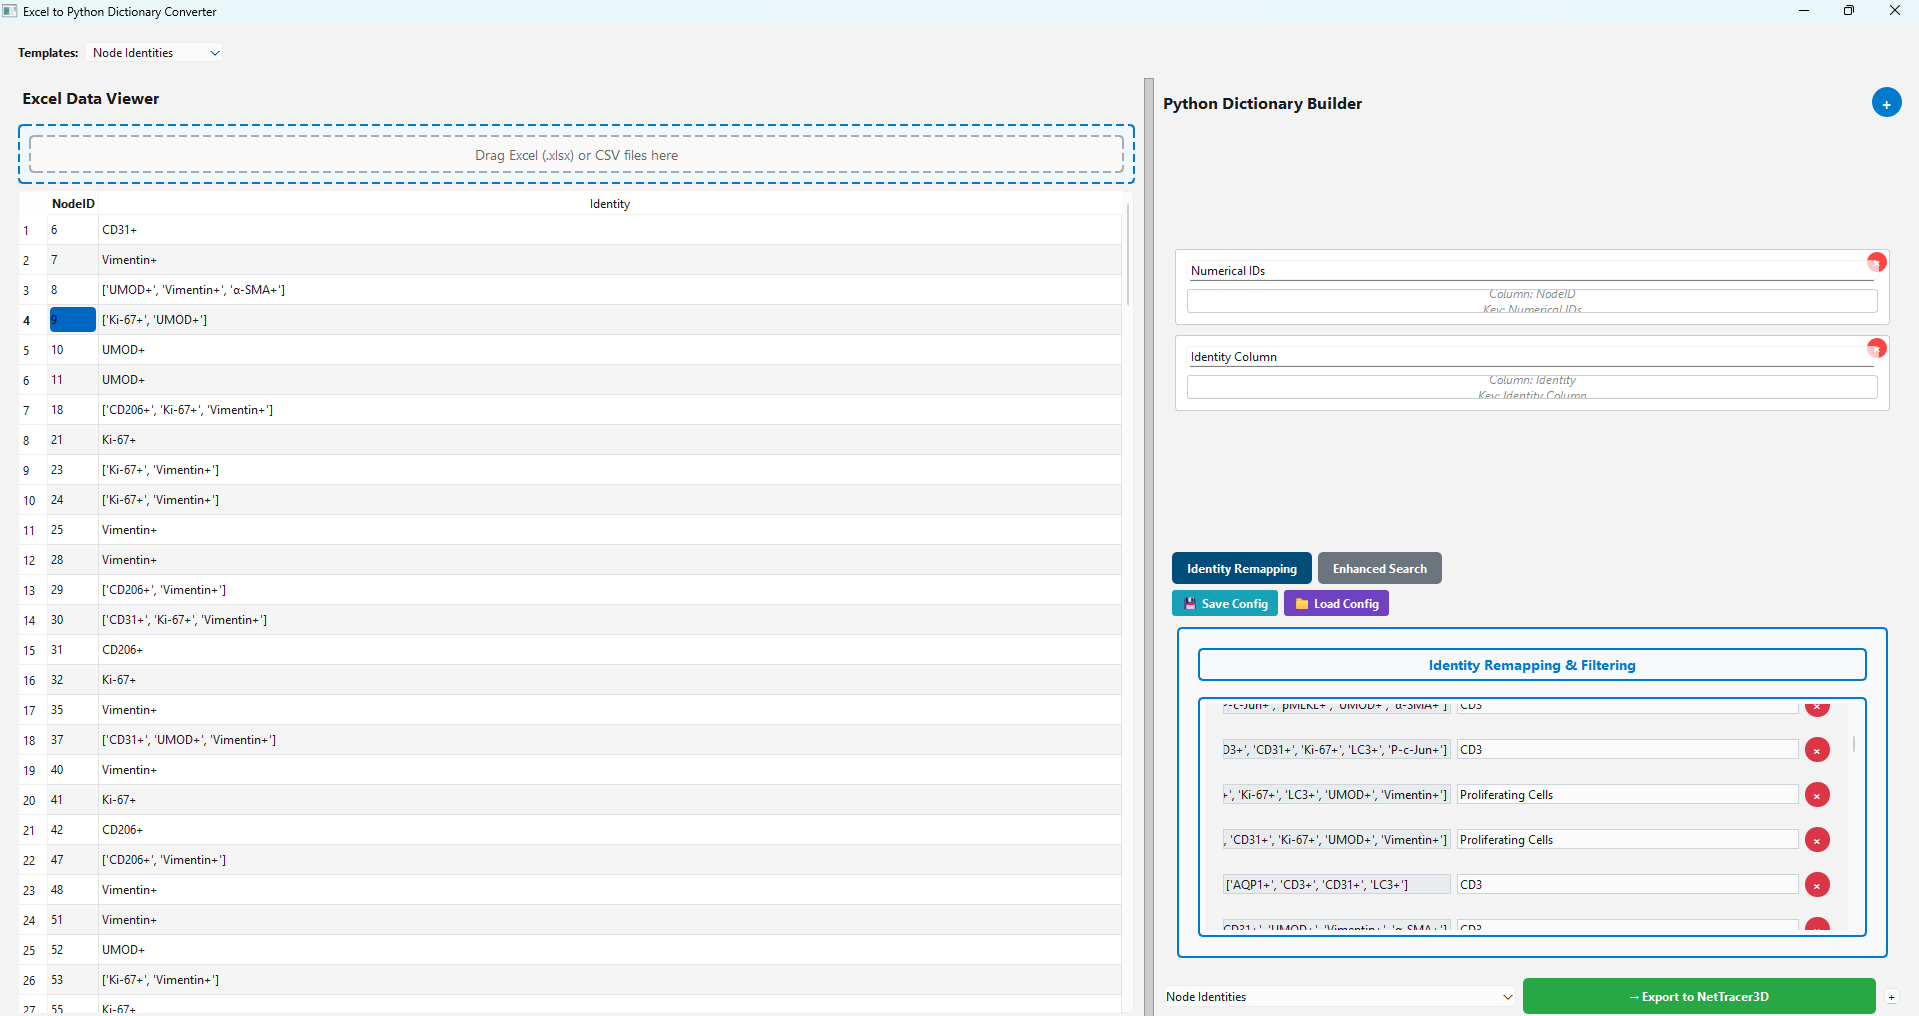
We press ‘Preview Classification’, which assigns all the combinations of identities containing the string classifications we setup to their new ID. If we then press the green ‘Export’ button, this data will be sent into NetTracer3D’s main window. See Using the Spreadsheet Loader for more information on using this tool.
Note if we really don’t want to have multiple node identities for a node and also don’t want to bother with the excel loader to reassign identities, we can just use ‘Process -> Modify Network/Properties’, then select ‘Force Any Multiple IDs to Pick a Single Random ID’ to force any multiple-ID node to randomly choose to be one of their sub-identities.
Here is what my group of cells look like with all cells forced to take on a single identity (note you don’t have to do this for most of the analytical functions, but the visualization ones work better with fewer groups of identities).
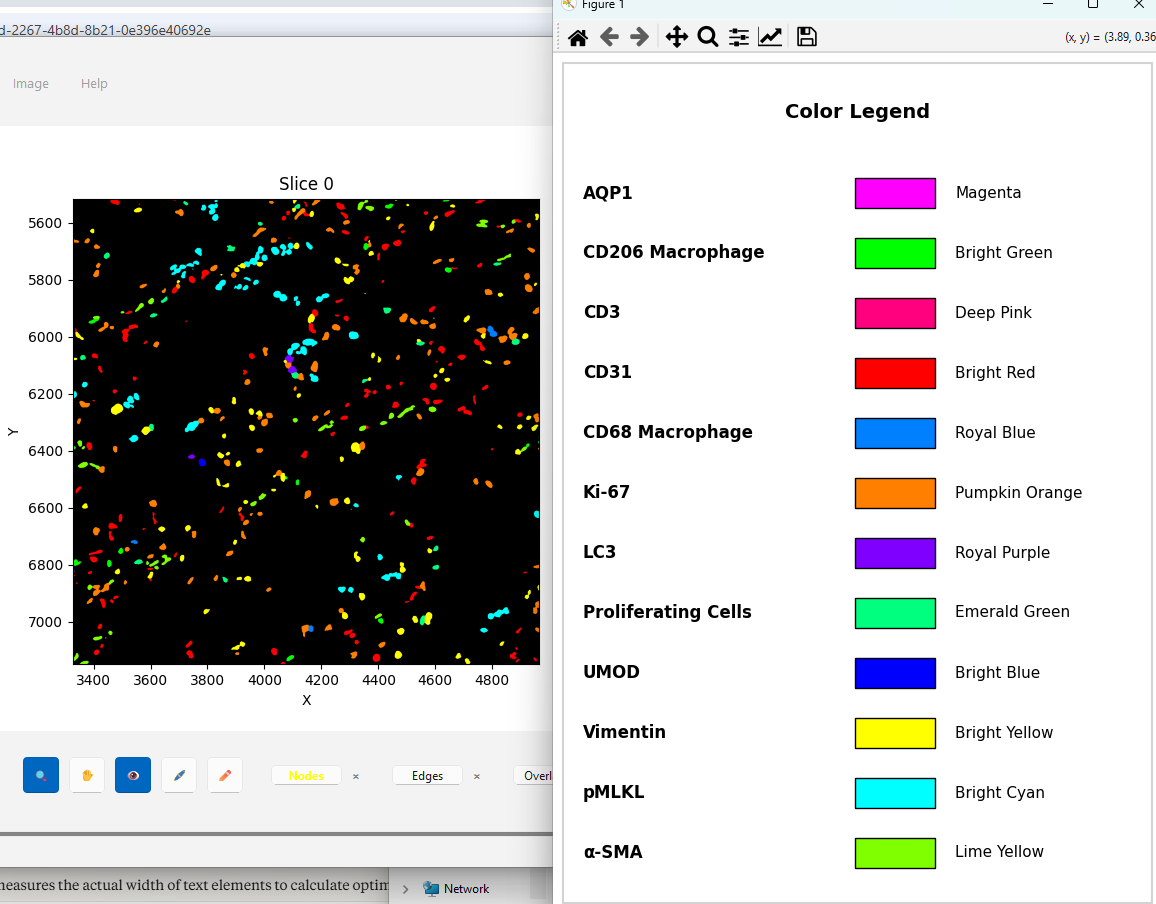
*You can make this overlay with ‘Analyze -> Data/Overlays -> Code Identities’
Next Steps
Once you have a hang on generating the default network types, proceed to the Labeling Branches and Branch Networks to learn about using NetTracer3D to label branches of objects and create branch networks.